Connecting Real-World Data Through Quantitative Analysis
Cassie is a 9-year-old who received the flu vaccine yet was hospitalized after contracting the flu in 2018. Cassie’s parent is torn on whether or not to give her the flu vaccine in 2019. Based on recent findings from the Center for Disease Control, the flu vaccines have reduced hospitalized risk by almost half (47%) in comparison to previous years (Stanglin, 2019). Is this due to the increased effectiveness of the vaccine or has the virulence of flu strains changed? Quantitative analysis can help answer such questions.
As a working professional, you will experience quantitative data in many different ways. These data will contribute to answering research questions, guiding conclusions, shaping decisions, and helping generate more questions. As part of the Final Project for this course, you will do just that. You will gain a better understanding of how quantitative data and their analyses provide an opportunity for you to see how a phenomenon can impact your field/discipline of study.
Your Final Project for this course will consist of a narrative/report in which you demonstrate your learning through a research question related to a dataset, the variables related to the research question, and the data analyzed using specific types of analysis to determine the results from the data.
There are three items you will use to complete your Final Project. The Final Project Overview, Final Project Worksheet, and Final Project Dataset are in this week’s Learning Resources:
1) Final Project Overview Download Final Project Overview – A document providing specific details about the Final Project criteria. Take time to review this document carefully and plan your time accordingly.
2) Final Project Worksheet Download Final Project Worksheet – A document that allows you to gather information/notes you need in order to complete your Final Project narrative/report due in Week 11. This Worksheet will be submitted in Week 3 and Week 5 of the course.
3) Final Project – A narrative/report you will develop, applying the criteria in the Final Project Overview and the Final Project Worksheet information gathered throughout the course. The required structure and format for this narrative/report is provided in Week 11.
The Final Project is a narrative/report you will develop, applying the criteria in the Final Project Overview and the Final Project Worksheet information gathered throughout the course. The required structure and format for this narrative/report are provided in the Final Project Overview as well as in Week 11.
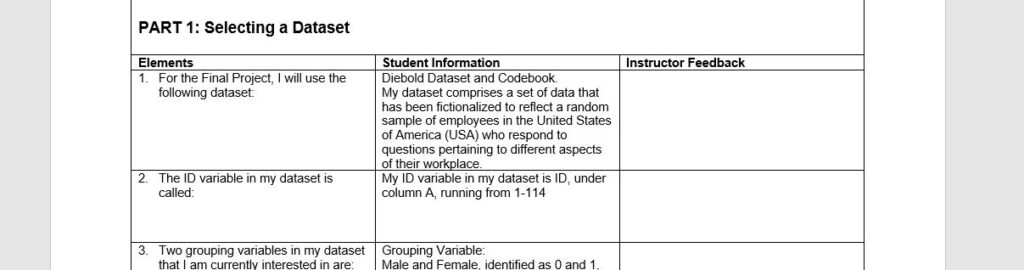
This week, you will begin your work on Part 1: Selecting a Dataset
Begin completing Part 1 of your Final Project Worksheet; however, it will not be submitted until Week 3 by Day 7.
Reference:
Stanglin, D. (2019). Flu widespread in US with 15.2 million cases since October, but experts see ‘low-severity’ season. Retrieved from USA Today https://www.usatoday.com/story/news/nation/2019/02/15/flu-season-15-m-cases-widespread-puerto-rico-47-states-cdc-says/2868271002/Part 2: Research Questions and Design of your Final Project Worksheet, you will create three research questions and identify a research design for each.
- Using the dataset you chose in Part 1, develop one descriptive research question, one comparative research question, and one relational research question.
- Identify the research design for each of your three research questions.
- Explore the dataset’s characteristics (e.g., population characteristics, sample size). As you become familiar with your dataset, be mindful of whether the dataset requires cleaning.
Choose from one of the datasets listed to use for your Final Project. You will need to download both the dataset and its codebook in order to complete the Final Project assignments throughout the course.
Diebold Dataset and Codebook
- This dataset is a fictionalized set of data reflecting how a random sample of employees in the United States might respond to questions regarding their perceptions of their value in the workplace, their skill level, training in self-advocacy, their job satisfaction, the amount of a raise they requested and whether they received it. Additionally, these fictitious participants were rated by their peers and supervisors (a 360 review).
Diebold, C. (n.d.). Diebold Dataset and Codebook. Charles Diebold. - Document: Diebold Dataset Download Diebold Dataset(Excel worksheet)
- Document: Diebold Dataset Download Diebold DatasetCodebook (Word document)
School Survey on Crime and Safety Dataset and Codebooks
- The dataset “is a cross-sectional survey of the nation’s public schools designed to provide estimates of school crime, discipline, disorder, programs and policies. Regular public schools were sampled. The data collection was conducted using a mail questionnaire with telephone follow-up. The data collection’s response rate was 62.9 percent. Key statistics produced from SSOCS:2016 include the frequency and types of disciplinary actions taken for select offenses; perceptions of other disciplinary problems, such as bullying, verbal abuse and disorder in the classroom; the presence and role of school security staff; parent and community involvement; staff training; mental health services available to students; and school policies and programs concerning crime and safety.” (National Center for Education Statistics, 2016, para. 1).
Reference:
National Center for Education Statistics. (2016). 2015-2016 School Survey on Crime and Safety. U.S. Department of Education. https://catalog.data.gov/dataset/school-survey-on-crime-and-safety-2016
- Document: School Survey on Crime and Safety Dataset (Excel worksheet)Download School Survey on Crime and Safety Dataset (Excel worksheet)
- Document: School Survey on Crime and Safety Codebook (Word Document)Download School Survey on Crime and Safety Codebook (Word Document)
- Document: School Survey on Crime and Safety Questionnaire Codebook (PDF)Download School Survey on Crime and Safety Questionnaire Codebook (PDF)
Fictional Working Sample Dataset and Codebook
This dataset provides information about adults’ interest in books and electronic tablet use. Demographic information includes gender, age, and characteristics of the town they live in. Note: The data in this sample are fictional and are meant for use within this course only. You cannot share any information based on this dataset outside of the classroom, as the information does not reflect actual participants or a real-world population.
- Document: Fictional Working Sample Dataset (Excel worksheet)Download Fictional Working Sample Dataset (Excel worksheet)
- Document: Fictional Working Sample Codebook (Word Document)
Answer preview for Connecting Real-World Data Through Quantitative Analysis
APA
1523 Words