Hypothesis Testing
A major client of your company is interested in the salary distributions of jobs in the state of Minnesota that range from $30,000 to $250,000 per year. As a Business Analyst, your boss asks you to research and analyze the salary distributions. You are given a spreadsheet that contains the following information:
- A listing of the jobs by title
- The salary (in dollars) for each job
In prior engagements, you have already explained to your client about the basic statistics and discussed the importance of constructing confidence intervals for the population mean. Your client says that he remembers a little bit about hypothesis testing, but he is a little fuzzy. He asks you to give him the full explanation of all steps in hypothesis testing and wants your conclusion about two claims concerning the average salary for all jobs in the state of Minnesota.
Instructions
The Excel spreadsheet contains four tabs. The first tab, labeled “data”, requires you to calculate the mean, standard deviation, and sample size using the correct Excel formulas. The next three tabs contain questions for you to complete. Ensure that you are completely answering all questions with steps shown, explanations, and correct formatting.
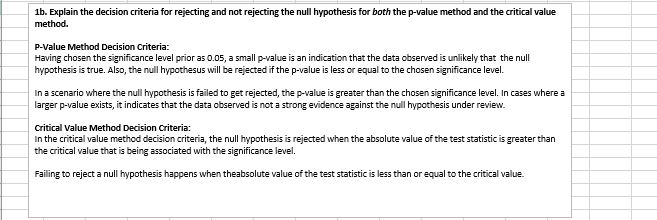
Ia. Describe the S steps in the process for hypothesis testing. Use complete sentences with o brief explanation of each step.
Step I: Hypotheses stating: As the first step, one should come up with the hypotheses, both null hypothesis and alternative hypothesis. By formulating the hypotheses, one is rest assured of having both a statement of no effect and a hypothesis to test on.
Step 2: Choosing and setting a significance level. Commonlyset at 0.05, a significance level helps one to reject the null hypothesis when it is trues in a standadized probability.
Step 3: Selection of a test statistic The most relevant test static is chosen, based on the type of data the hypothesis testing is using. Common test statics include a test, z-test and chi-square test.
Step 4: Formulation of the decision rule. At this point of hypothesis testing, one has the significance level well selected. Based on the significance level that is earlier chosen, one takes the next step of determining the regions that are critical in the distribution of test, and those that would lead to the null hypothesis being rejected in case the test reaches a static point.
Step 5: Data collection and test statistic calculation. At this print, data is collected for the sample population and sratistics calculated using the chosen formulae.
Step 6: Decision making. In this step, calculated test statistic are compared with values that are critical in the scope. Null hypothesis is declined for all test cases that test that dall in critical regions.
Step 7: Drawing a conclusion. Based on the problem under resolution, a decision is ,ade and a conclusion made in support of the alternative hypothesis.
Steps: Results interpretation. The significance of the results are discussed and implications on the population if implimentation happens.
Answer preview for Hypothesis Testing

APA
600 Words
