Hypothesis Testing from Two Samples
Nightingale Shoes has hired you to run consulting work for their company. They need to understand the demographic and gender that is purchasing their shoes to determine how they should advertise. They also need you to compare their shoe sales during two different years.
The spreadsheet below contains three hypothesis tests to run.
Instructions
Work through each hypothesis test in the spreadsheet above and answer all questions provided. Note that each question is presented on a separate tab in the spreadsheet.
You must submit the spreadsheet with the completed calculations, answers, and analysis. Ensure that you are completely answering all questions with steps shown, explanations, and correct formatting.
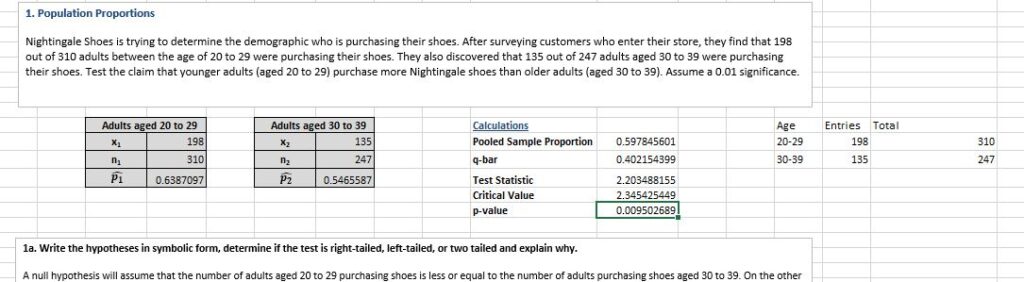
Nightingale Shoes is trying to determine the demographic who is purchasing their shoes. After surveying customers who enter their store, they find that 198 out of 310 adults between the age of 20 to 29 were purchasing their shoes. They also discovered that 135 out of 247 adults aged 30 to 39 were purchasing their shoes. Test the claim that younger adults (aged 20 to 29) purchase more Nightingale shoes than older adults (aged 30 to 39). Assume a 0.01 significance.
2. Population Means – Independent Samples
Nightingale shoes is interested to know who is spending more on their brand: women or men. They surveyed the first 250 people who entered their store. They found that 92 men on average spent $68 with a standard deviation of $11. On the other hand, 158 women spent $75 with a standard deviation of $32. Test the claim that women spend more on Nightingale shoes then men. Assume a 0.05 significance level and the population standard deviations are unknown.
Nightingale shoes is looking at the productivity of a sample of its stores. They look at the average number of shoe sales per month in 2021 and compare the results with the average number of shoe sales per month in 2022. Based on the data in the table below, test the claim that the average number of monthly shoe sales increased from 2021 to 2022 using a 0.01 significance level. Assume that the population standard deviations are unknown.
3a. Write the hypotheses in symbolic form, determine if the test is right-tailed, left-tailed, or two tailed and explain why.
Answer preview for Hypothesis Testing from Two Samples
APA
900 Words