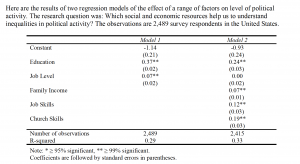
Interpreting regression table
It is a five part question that ask you to interpret the values on the regression table and find the effect/calculate when there is a change in a variable according to the regression table. I will send the specific problem set once you start working on the question.
20181106183602regression_table
Solution Preview
Regression Model 1: Y = -1.14 + 0.37X1 + 0.07X2
Where: Y = Political Activity
X1 = Education
X2 = Job level
N = 2,489
R = 0.29
Regression model 2: Y = -0.93 + 0.24 X1 + 0.07 X3 + 0.12 X4 + 0.19 X5
Where: X3 = Family income
X5 = Job skills
X6 = Church skills
N = 2,415
R = 0.33
Question and Answer
- What is the estimated effect of an additional level of educational qualification on the number of political activities undertaken by respondents? Show your calculations based on Model 1.
(503 words)

